Tips And Examples For Creating A Data Visualization Resume
Image Source: windows.net
# Table of Contents
| Article Outline | |
| — | — |
| Introduction | |
| Why Include Data Visualization in Your Resume? | |
| Types of Data Visualization | |
| Top Data Visualization Tools to Use in Your Resume | |
| Tips on Creating a data visualization resume | |
| Examples of Data Visualization Resumes | |
| Common Mistakes to Avoid | |
| How to Make Your Data Visualization Resume Stand Out | |
| Benefits of a Data Visualization Resume | |
| Hiring Manager Perspective on Data Visualization Resumes | |
| Conclusion | |
| FAQs | |
# Data Visualization Resume: Why It Matters and How to Do It Right
## Introduction
When it comes to creating a standout resume, there are many things you can do to make yourself stand out from the crowd. One of the most effective ways to do this is by incorporating data visualization into your resume.
In this article, we’ll explore why data visualization is important in resumes, the different types of data visualization you can use, some of the top tools to help you create your data visualization resume, as well as some tips on how to do it right.
## Why Include Data Visualization in Your Resume?
In today’s data-driven world, employers are looking for candidates who can not only collect and analyze data but also present it in a visually appealing and understandable way. By including data visualization in your resume, you’re demonstrating that you have strong data analysis skills and the ability to effectively communicate your findings.
Additionally, a well-designed data visualization can help you stand out from other candidates by making your resume more memorable and engaging. It can also show your creativity and attention to detail, which are valuable traits in many industries.
## Types of Data Visualization
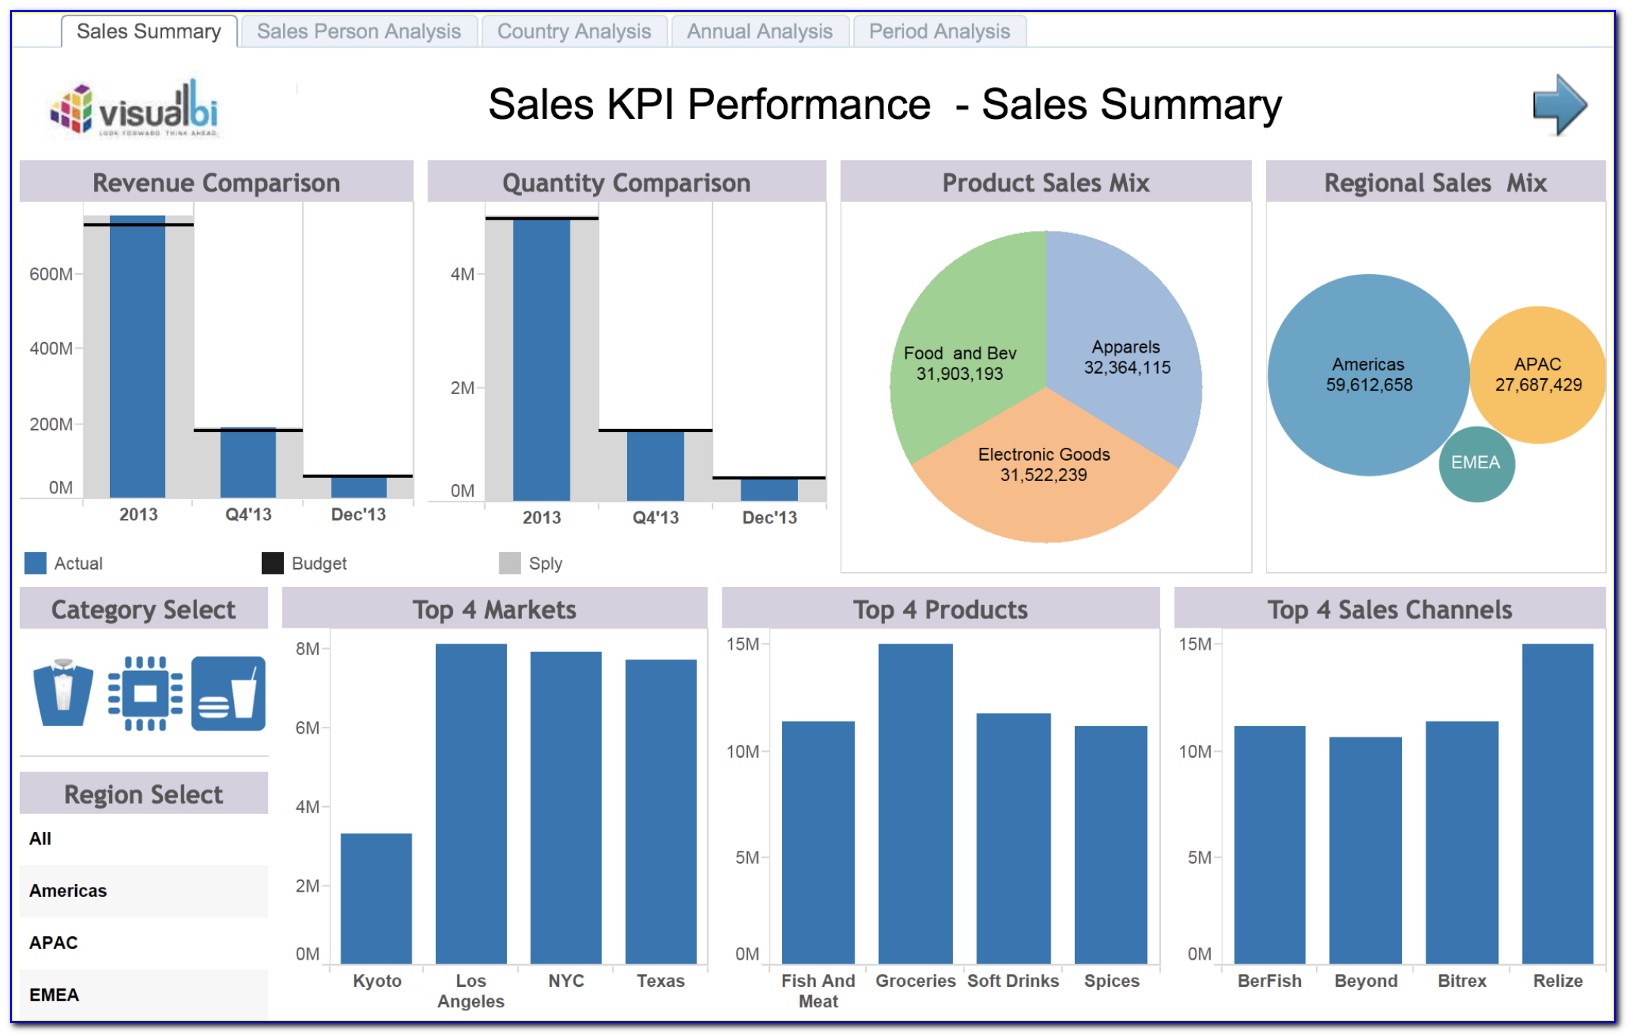
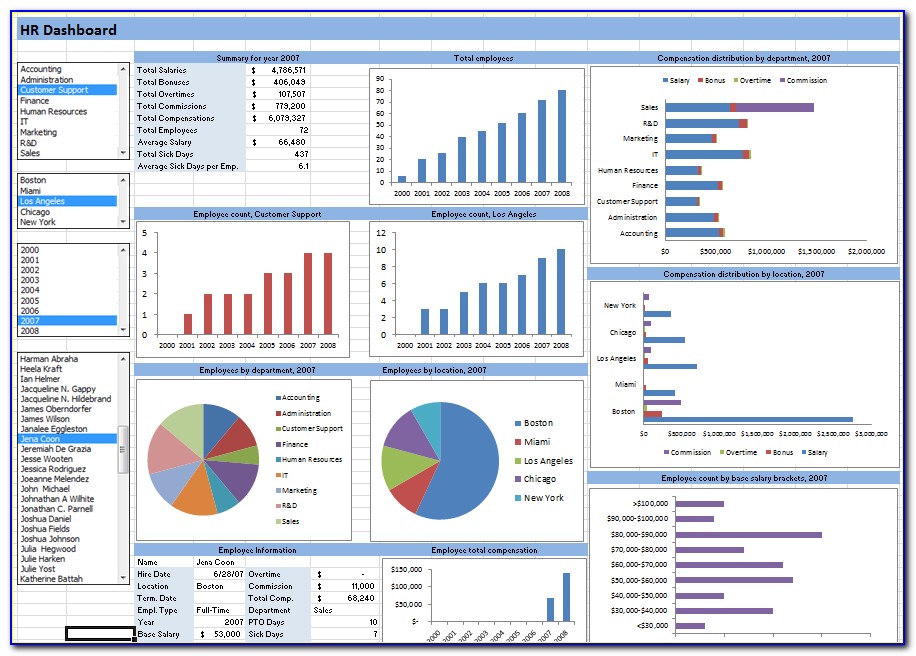
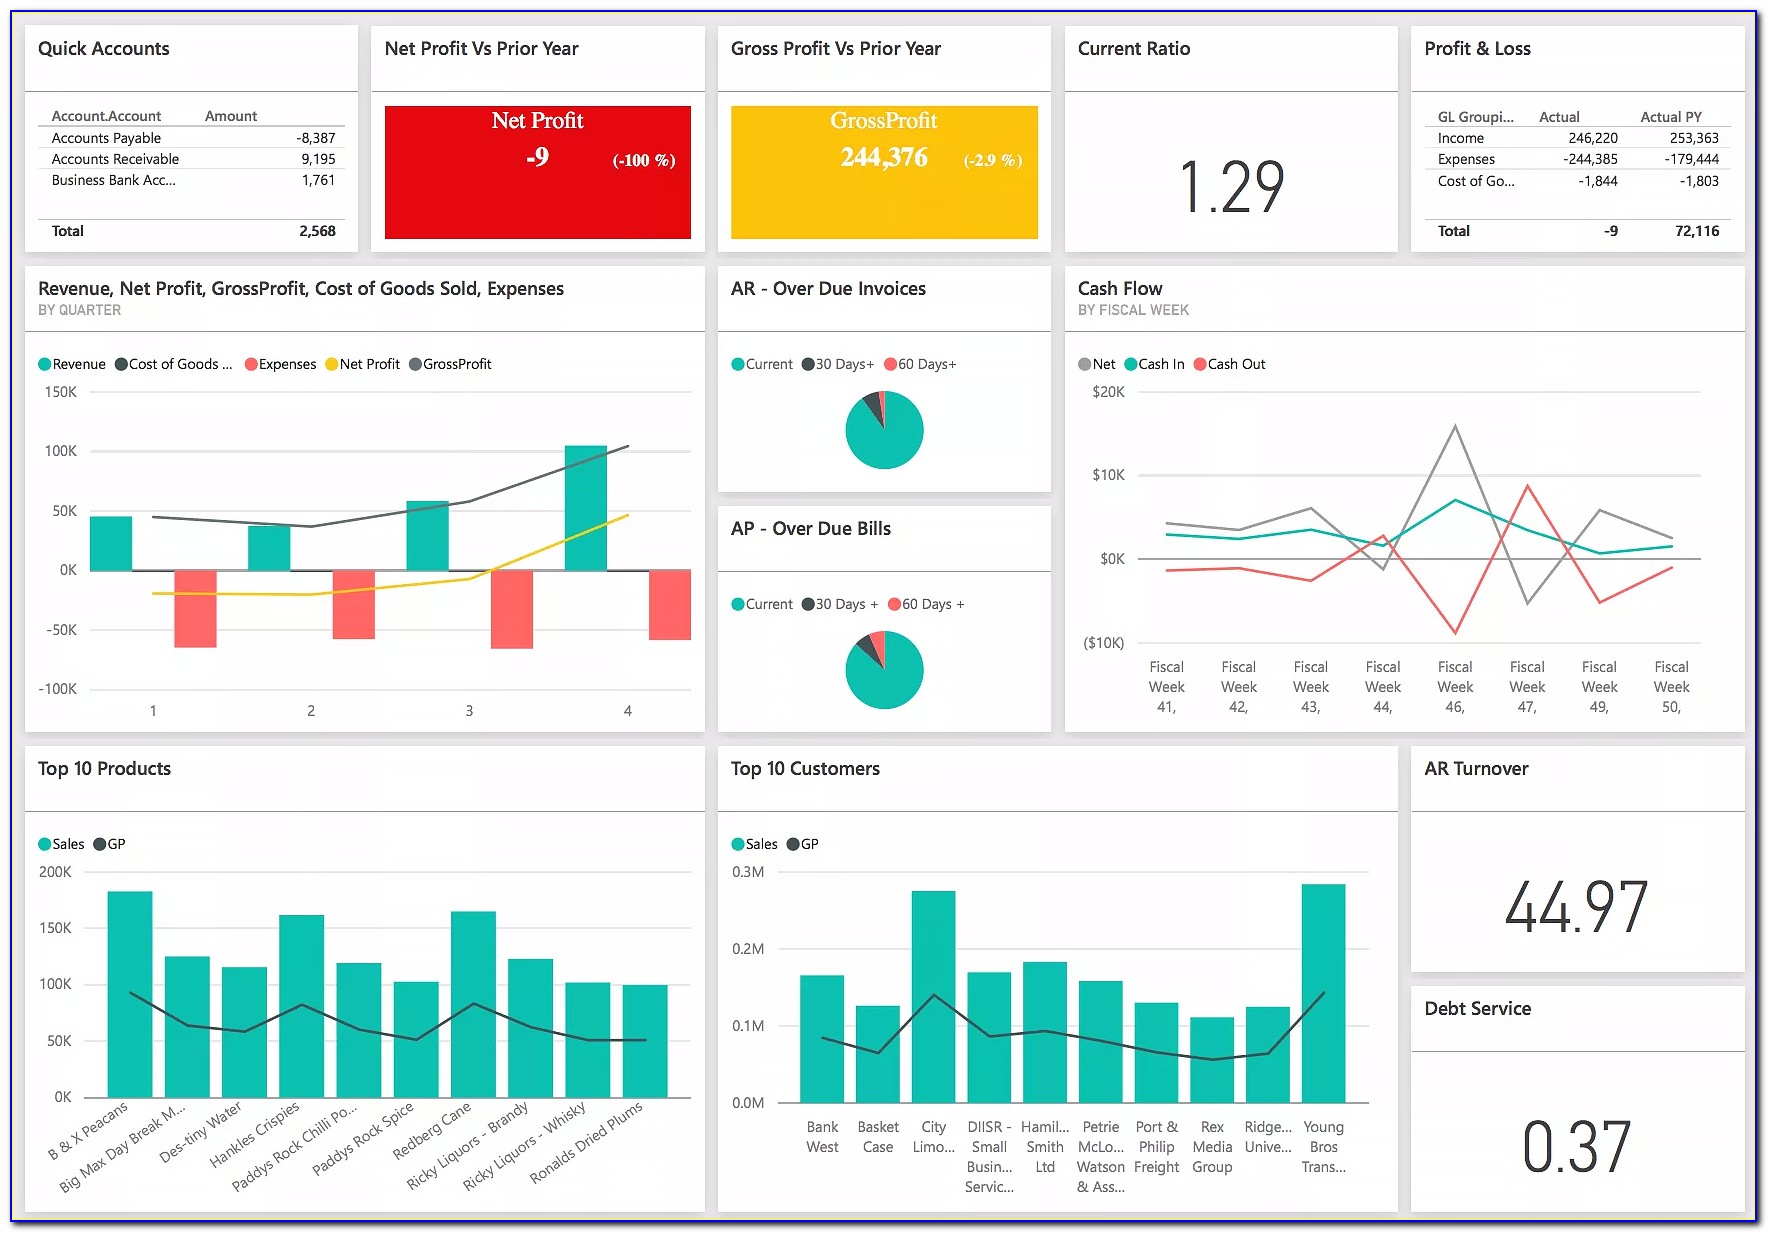
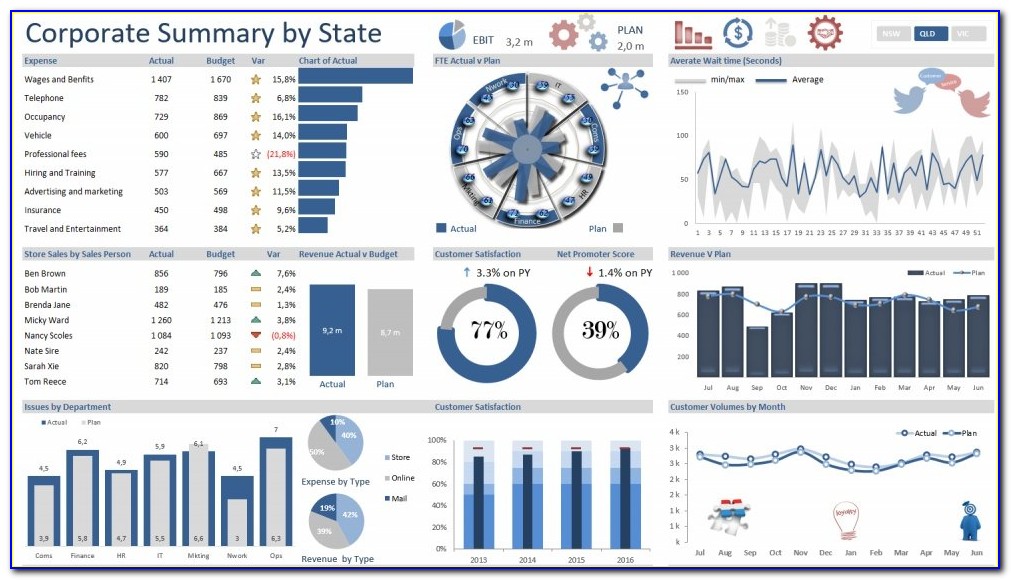
There are many different types of data visualization that you can use in your resume, depending on the type of information you want to convey. Some of the most common types include:
– Bar charts
– Line charts
– Pie charts
– Tables
– Infographics
– Heat maps
– Scatter plots
– Word clouds
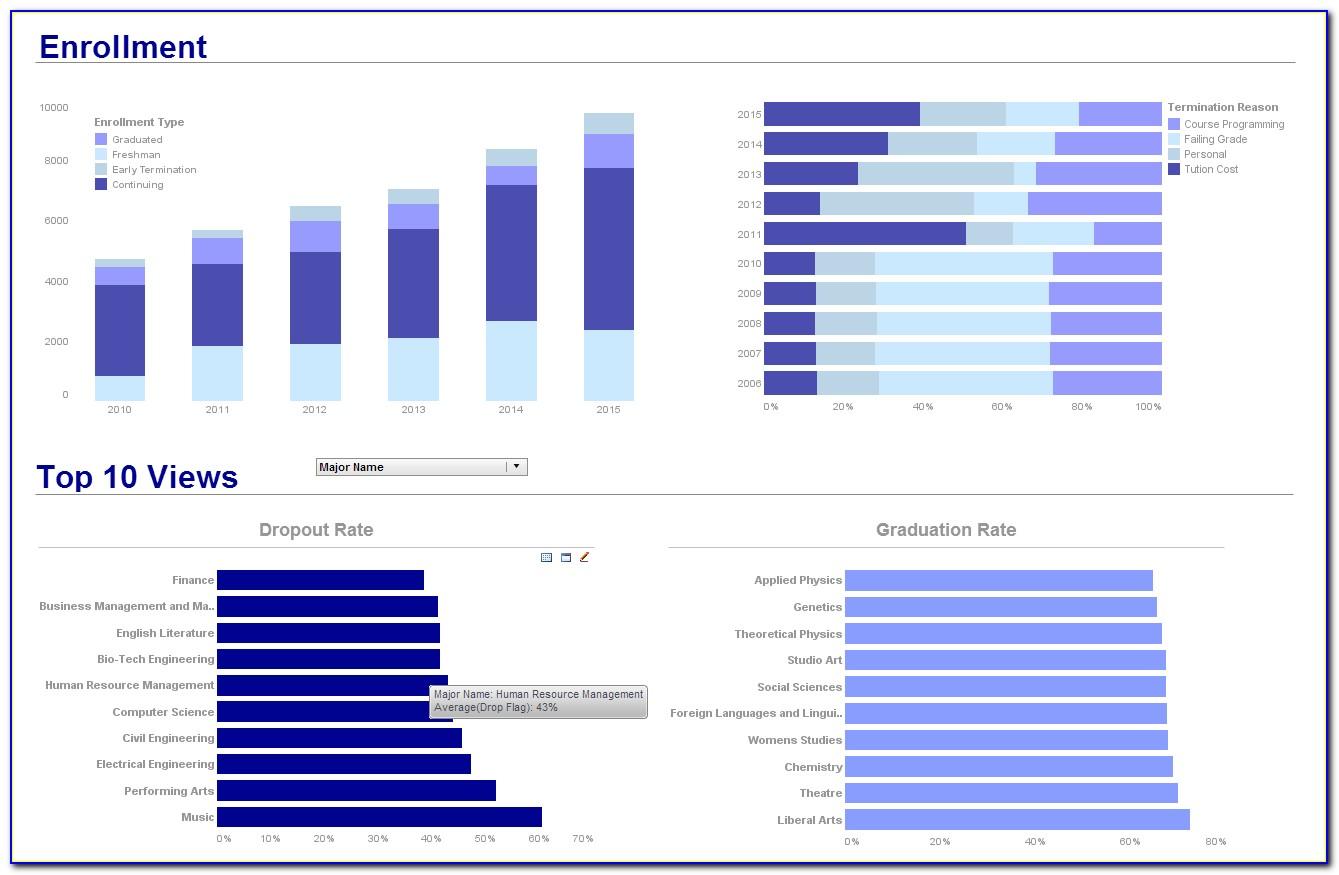
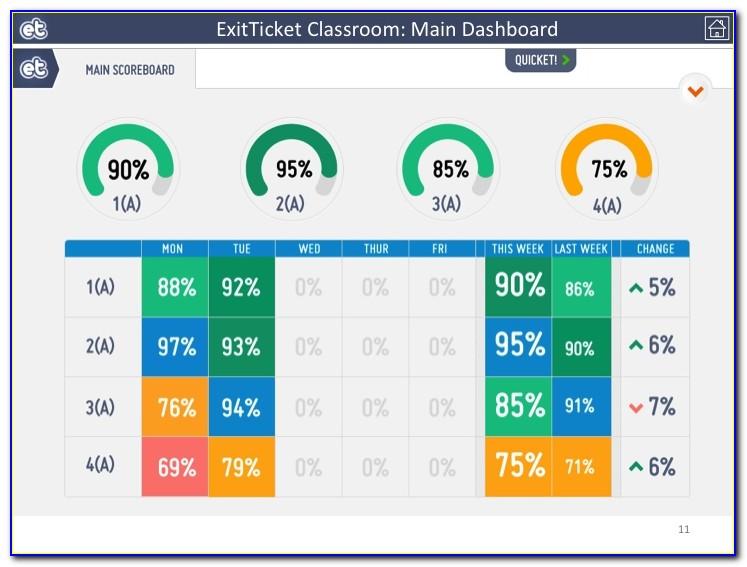
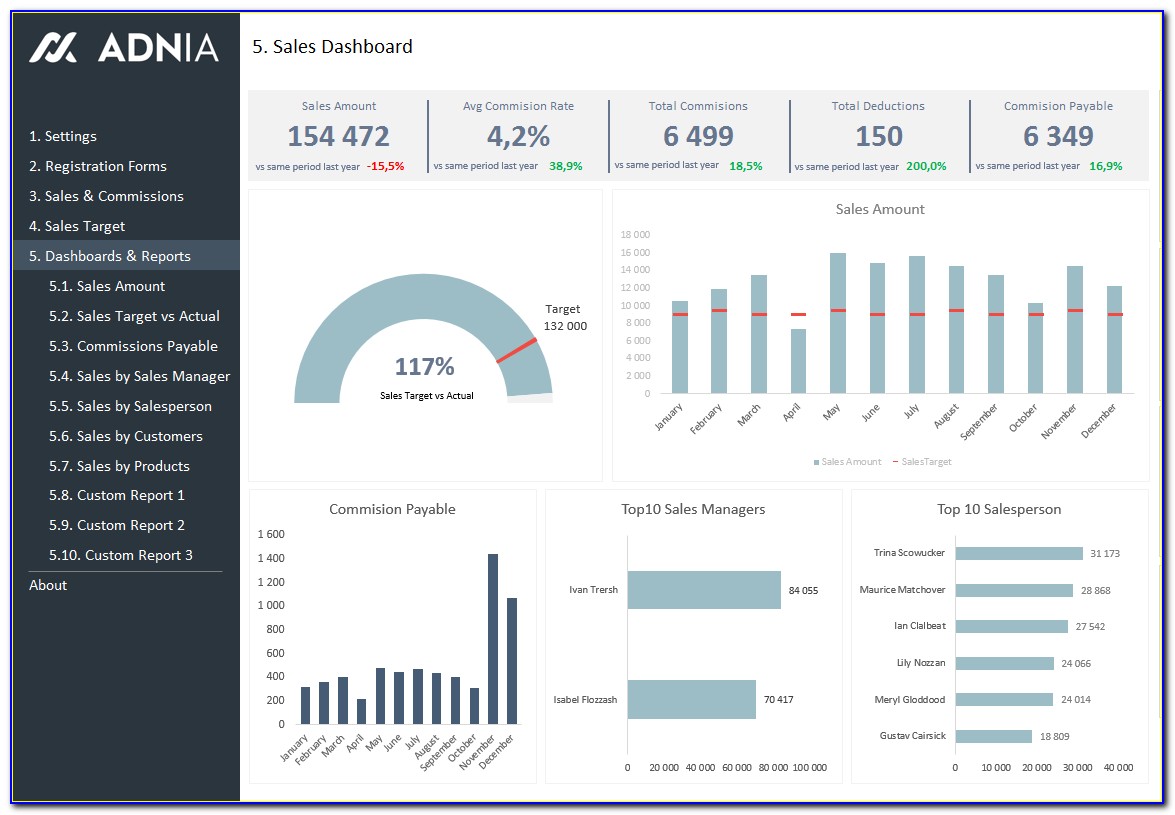
When choosing a type of data visualization, it’s important to consider what data you want to highlight and what type of story you want to tell. For example, a line chart might be a good choice for showing trends over time, while a pie chart is better suited for showing proportions.
## Top Data Visualization Tools to Use in Your Resume
There are many tools available to help you create stunning data visualizations for your resume. Some of the most popular include:
– Tableau
– Power BI
– Google Charts
– Infogram
– Piktochart
– Canva
– Visme
These tools vary in their complexity and features, so it’s important to choose one that suits your needs and skill level.
## Tips on Creating a Data Visualization Resume
When creating your data visualization resume, there are some important tips to keep in mind:
– Choose the right type of visualization for the data you want to present
– Keep it simple and easy to read
– Use color and contrast to draw attention to important information
– Use consistent formatting throughout
– Make sure the visualization is relevant to the job you’re applying for
– Keep the overall design clean and professional
## Examples of Data Visualization Resumes
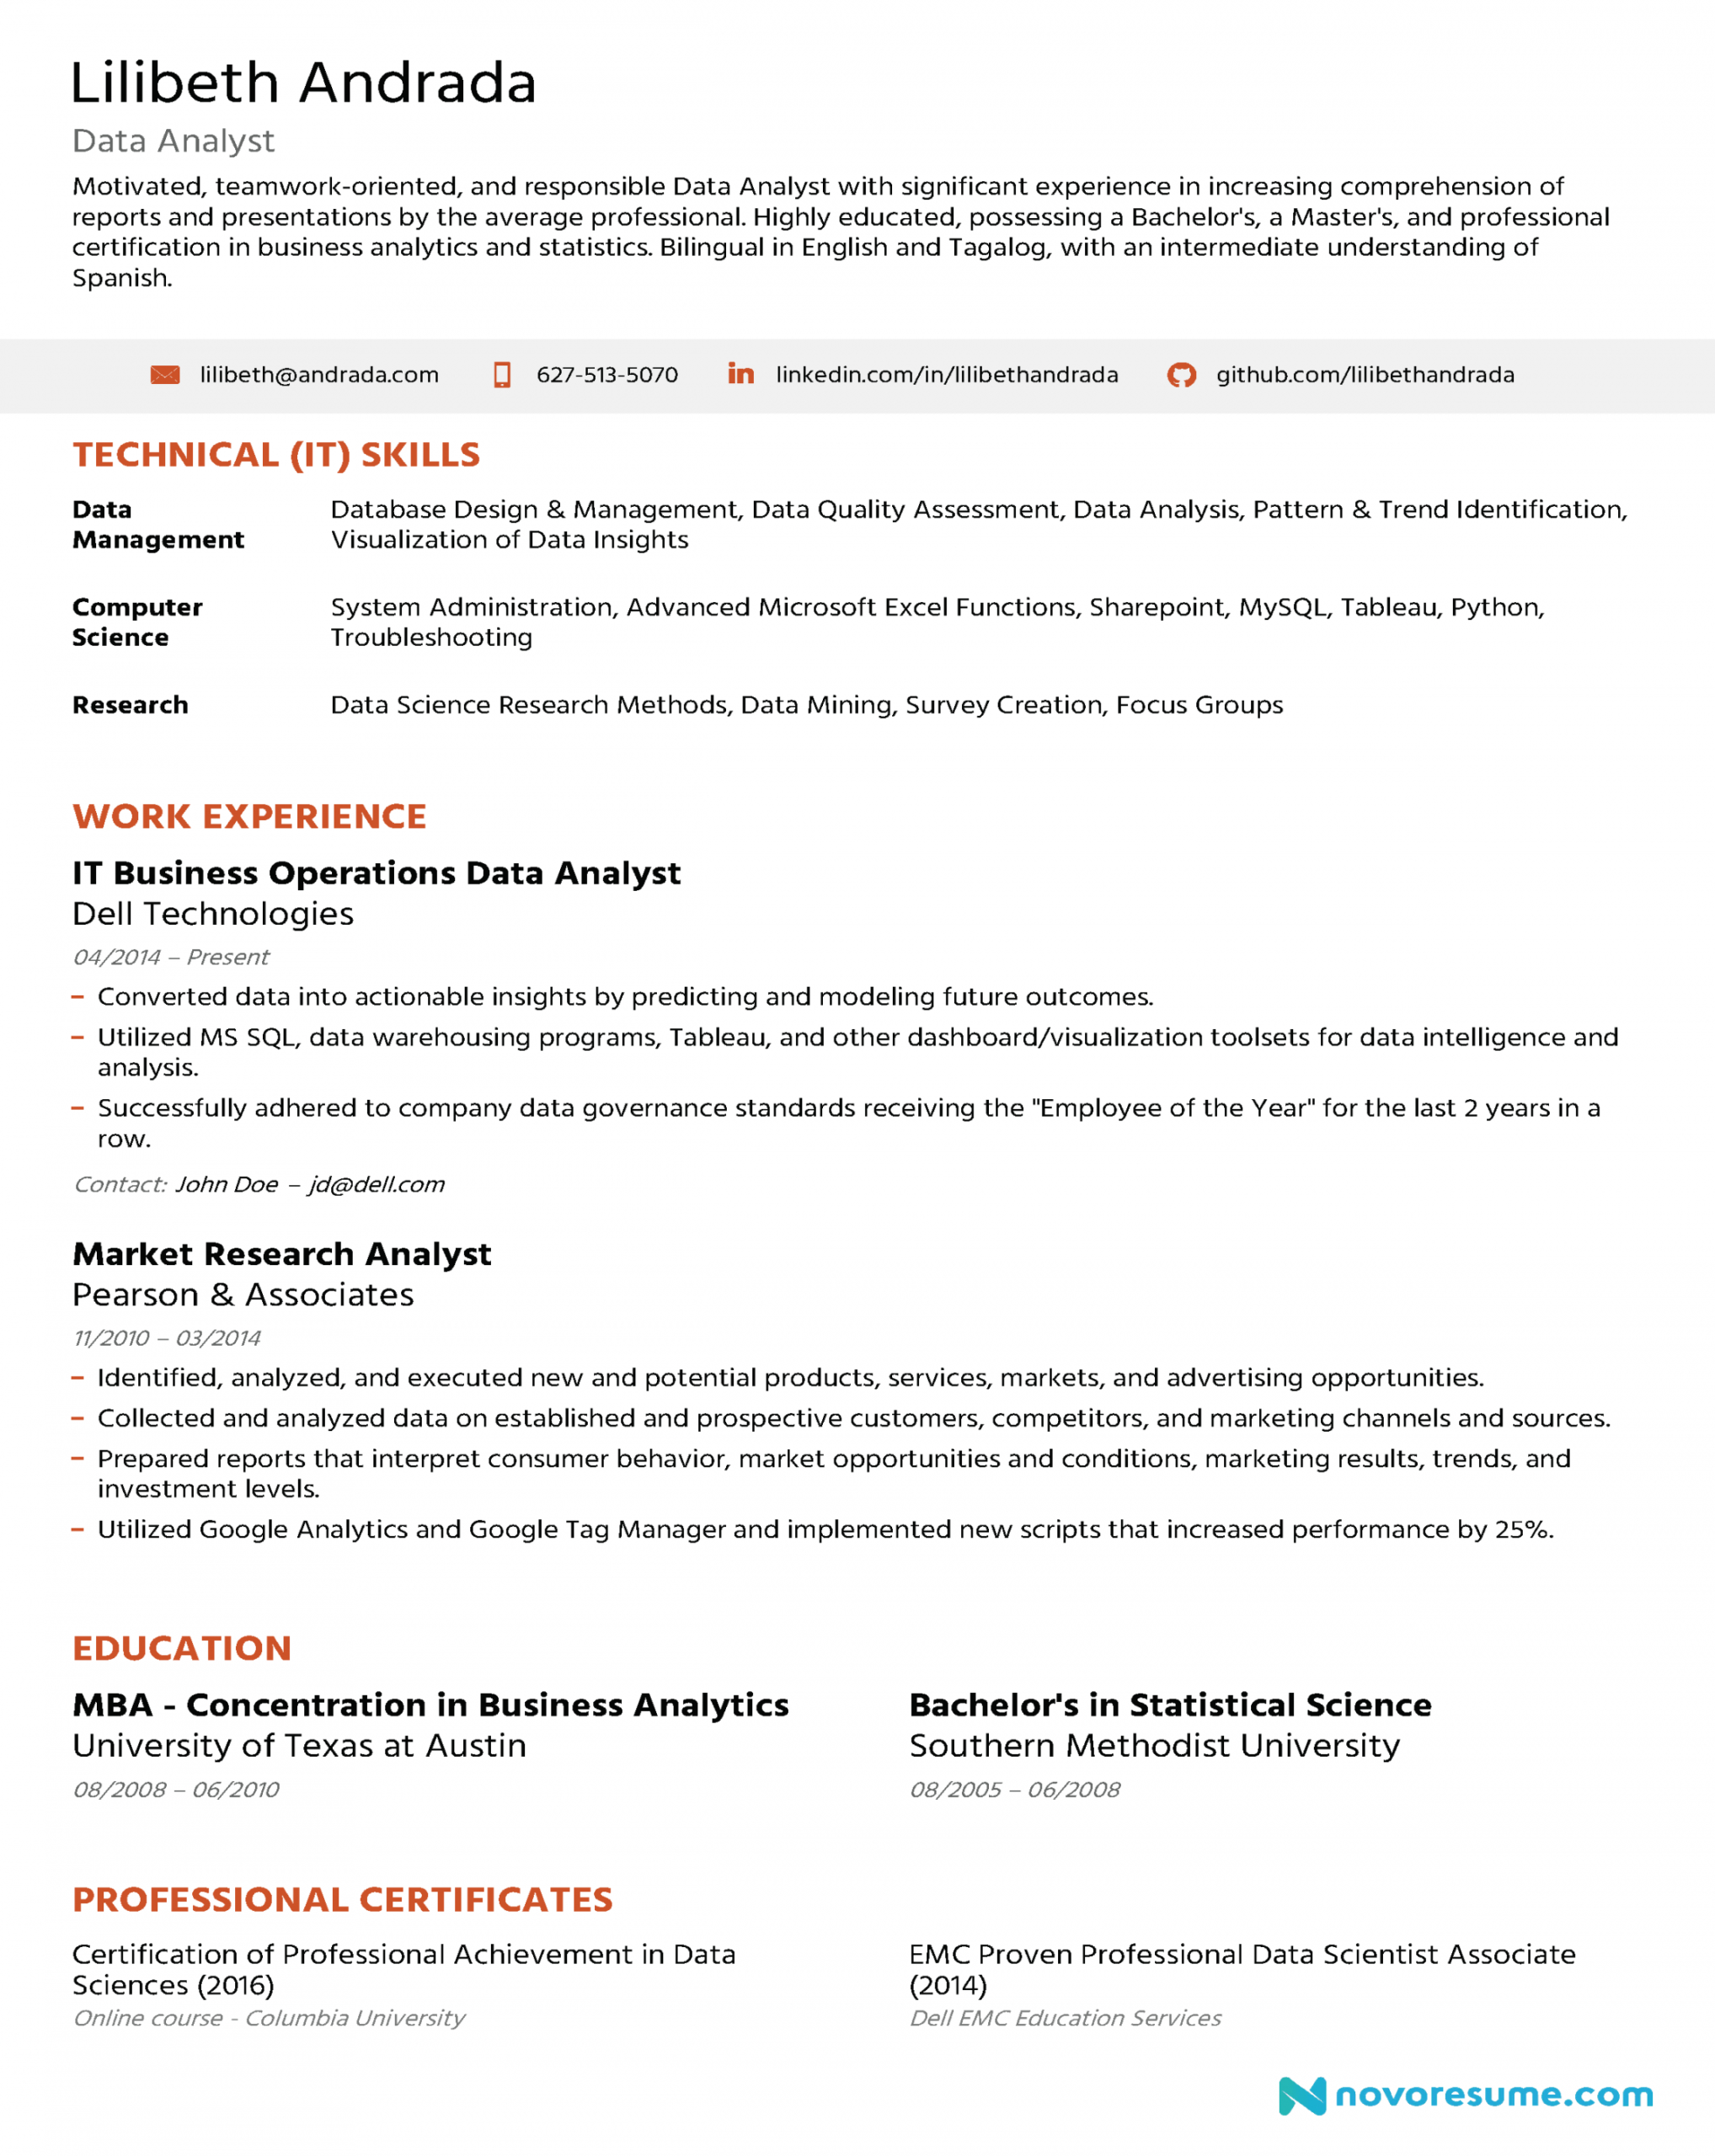
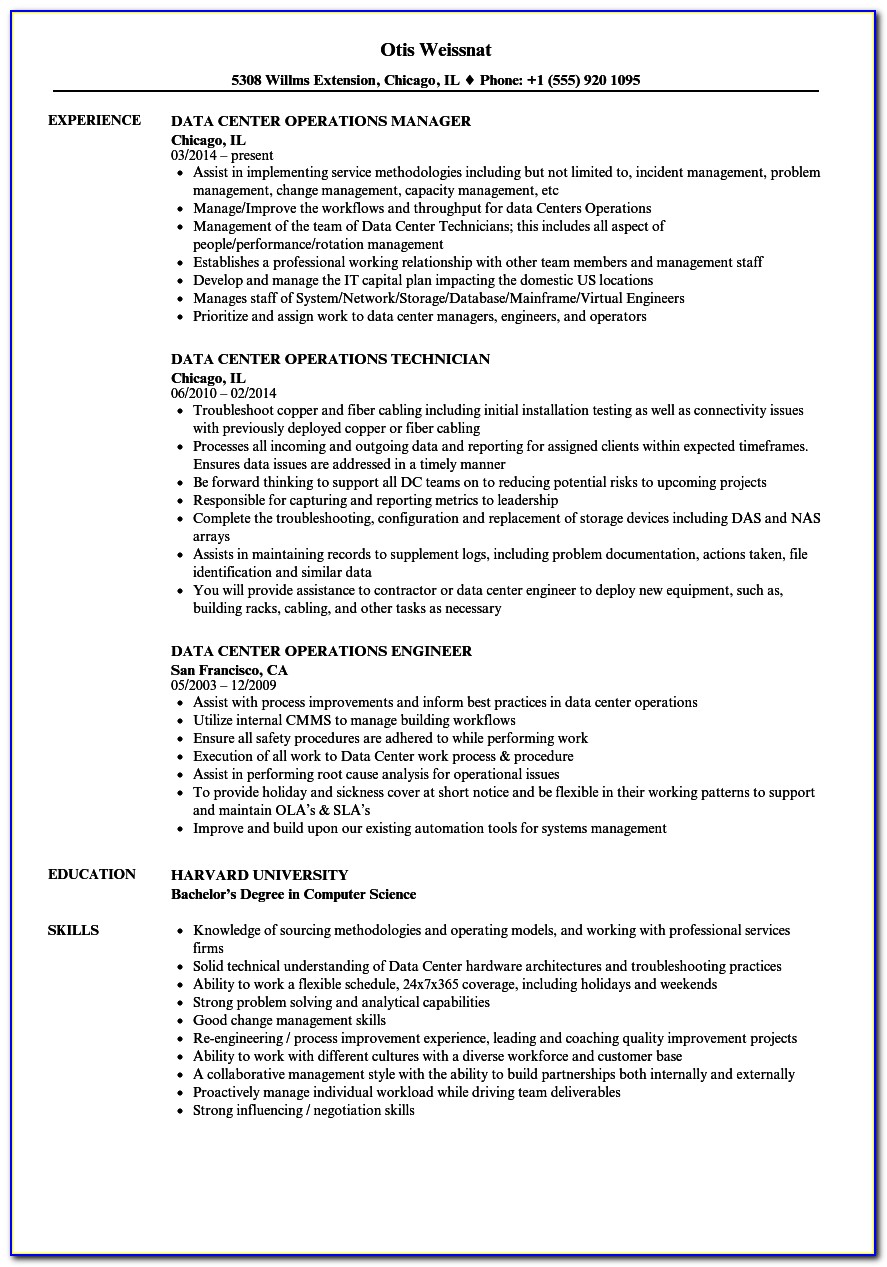
To get you inspired, here are some examples of data visualization resumes:
– [The Social Media Specialist Resume by Chris Liu](https://www.trendhunter.com/portfolio/chris-liu-the-social-media-specialist-resume)
– [The Data Analyst Resume by Matthew Taylor](https://www.behance.net/gallery/83736499/Data-Analyst-Resume)
– [The Graphic Designer Resume by Irene Quiles](https://www.behance.net/gallery/56509627/Resume)
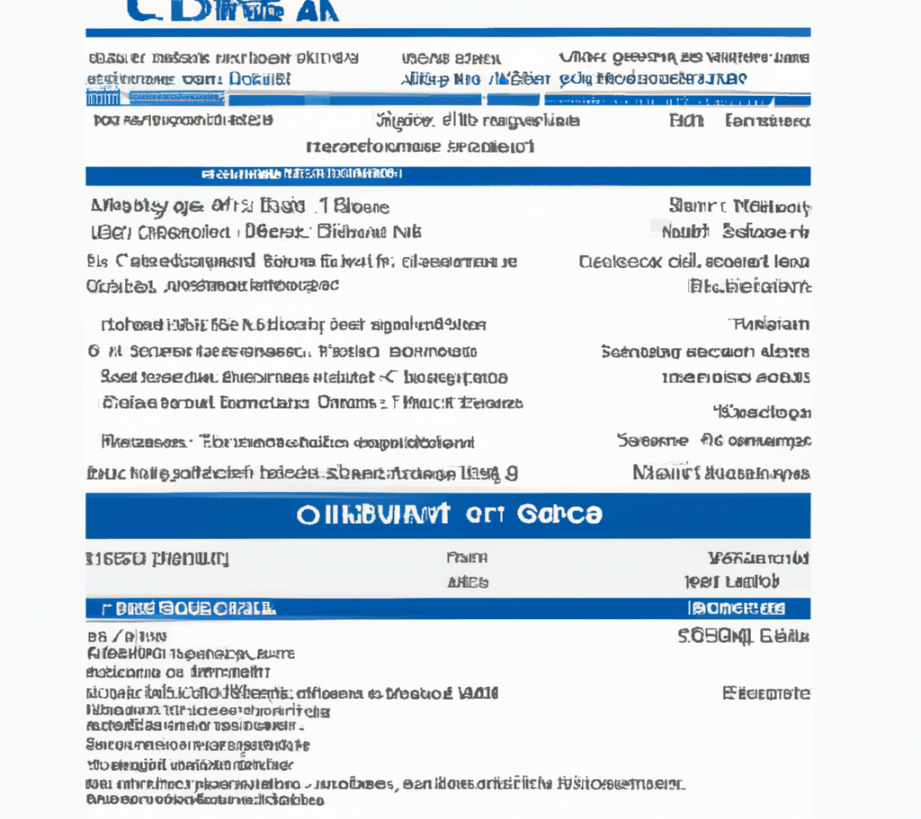
Each of these resumes uses data visualization in a creative and effective way to highlight the candidate’s skills and experience.
## Common Mistakes to Avoid
When creating a data visualization resume, there are some common mistakes to avoid:
– Using too many visualizations or making them too complex
– Focusing too much on the design at the expense of content
– Using irrelevant data or visualizations that don’t add value
– Neglecting to include important information in text form
– Using outdated or poorly designed tools
## How to Make Your Data Visualization Resume Stand Out
To make your data visualization resume stand out, consider these tips:
– Choose a unique and eye-catching design
– Use creative and relevant data visualizations
– Show your personality through the design and content
– Include a clear and concise summary of your skills and experience
– Customize your resume for each job application
## Benefits of a Data Visualization Resume
There are many benefits to creating a data visualization resume, including:
– Standing out from other candidates
– Demonstrating your data analysis and visualization skills
– Making your resume more engaging and memorable
– Showing your creativity and attention to detail
– Highlighting your relevant experience and skills
## Hiring Manager Perspective on Data Visualization Resumes
From a hiring manager’s perspective, a well-designed data visualization resume can be a breath of fresh air compared to the usual text-heavy resumes. It can help the candidate stand out and make a strong impression, especially if the visualization is relevant to the job they’re applying for.
However, it’s important to remember that the content of the resume is still the most important factor. The visualization should enhance the text and not distract from it.
## Conclusion
If you’re looking to create a standout resume, incorporating data visualization is a great way to do it. By choosing the right type of visualization, using the right tools, and following some basic tips, you can create a resume that showcases your skills and experience in a visually appealing and memorable way.
## FAQs
1. What types of data visualization should I use in my resume?
2. What tools can I use to create data visualizations for my resume?
3. How can I make sure my data visualization resume is relevant to the job I’m applying for?
4. Is it better to use a simple or complex data visualization in my resume?
5. How important is the content of the resume compared to the visualization?
